Maclean’s has included choices from the Macdonald-Laurier Institute’s Brian Lee Crowley and Philip Cross as part of its “75 charts every Canadian should watch in 2017” feature.
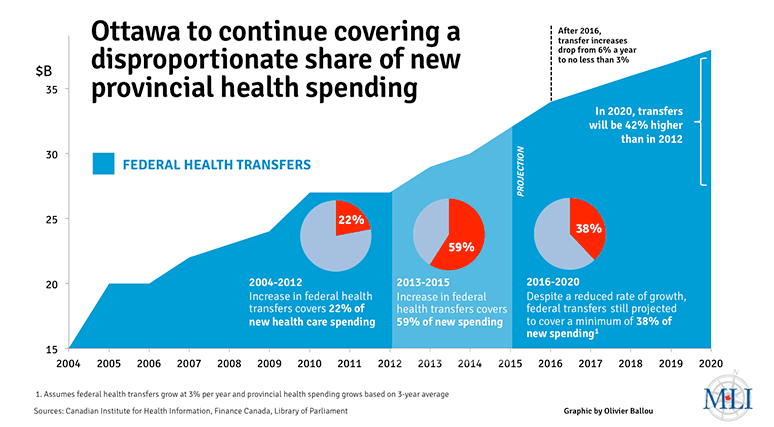
Crowley selected a chart produced by MLI that shows Ottawa continues to cover a disproportionate share of health spending.
“The provinces and territories claim that Ottawa’s so-called cuts to health-care transfers will force them to ‘do more with less.’ Not so”, writes Crowley. “Not only have federal health-care transfers grown by half over the past decade, the current trends will see Ottawa covering nearly 40 cents of every new dollar that provincial and territorial governments put into heath care”.
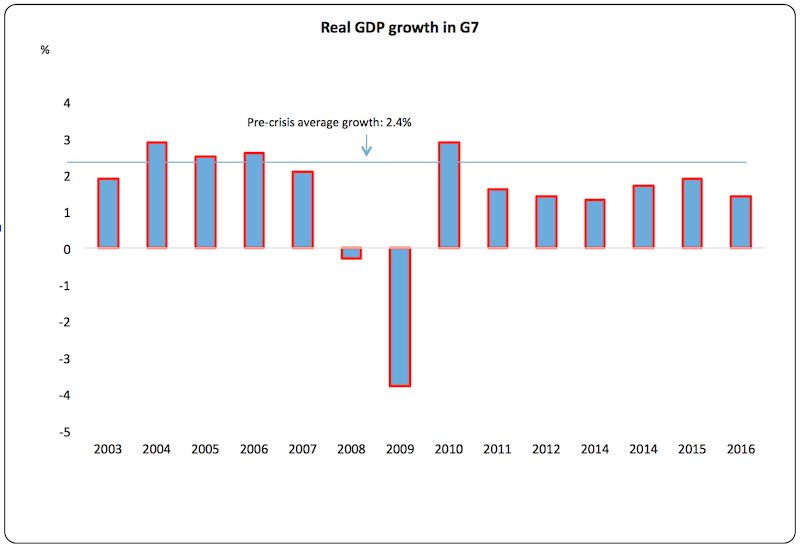
Cross’ chart address slow GDP growth among the G7 nations.
“A wave of new G7 leaders took power as the global recession began in 2007, promising to fix what ailed the economy”, writes Cross. “Instead, average annual real GDP growth in the G7 has languished at 0.9 per cent over the past decade, compared with 2.4 per cent before the crisis (which is the straight line in the graph)”.


