
THE CANADA AT A CROSSROADS SERIES
Canada is at a crossroads. The issues confronting Canada in 2025 go beyond mere setbacks and can more accurately be called crises. Unless they are resolved quickly, we face a deep and potentially permanent loss of our national standard of living and quality of life.
We hereby introduce the “Canada at the Crossroads” series of reports from the Macdonald-Laurier Institute. Each one is a relatively short essay explaining the problem at hand and outlining potential solutions. This series will not propose minor tweaks to existing strategies, nor will it look only for modest course corrections. Canada is beset by incompetent governance, runaway and rampant ideology, social malaise, and a national identity crisis.
Its future is at stake – and the time for small, hesitant steps has passed. It is in this spirit that we invite readers to join us as we confront the problems facing our country and set out serious, disruptive ideas to make 2025 the year Canada began to step back from the brink.
VOLUME 3: DOLLARS AND SENSE – THE CASE FOR CUTTING INCOME TAXES
By Ross McKitrick
April 3, 2025
While Canada’s income tax burden is similar to that of many other developed countries, it is conspicuously higher than that in the US. Taking into account income taxes and income-contingent benefits, Canadians, even at the low-income level, face typical marginal income tax rates of nearly 50 per cent. In addition to the direct impact on the cost of living, the heavy income tax burden drives the ongoing loss of highly skilled workers and investment to the United States, where they face a substantially lower tax burden in any state they select.
Despite collecting so much in taxes the federal government has continued running deficits and accumulating debt. The federal government’s problem is overspending, not a lack of revenue. Had the federal government kept spending capped at a constant fraction of gross domestic product (GDP) over the past decade, spending would be 15 per cent lower than it is currently. Therefore, any discussion of tax policy must presuppose that the government will undertake spending reductions to create room for tax cuts while also eliminating the federal deficit. Moreover, tax cuts are expansionary. Recent research has shown that ambitious tax cuts can be implemented and financed with modest spending reductions. Research has also shown that because Canadian tax rates are so high, over the long term a cut to our income tax rates may be largely self-financing because it will lead to an expansion of the tax base.
Tax reforms can create an impression of being regressive. However, an adjustment to the basic personal deduction would largely correct this. We need to consider raising the threshold for the top tax bracket to help attain something closer to parity between Canadian tax rates and those of at least some US states.
Canada versus its peers
Canadian taxes are extremely high. Taking income, sales, and deferred taxes into account, Munro and Fuss (2024) calculate that Canadians give nearly half their income each year to the government. This essay reviews data on the current income tax burden in Canada and what can be done to reduce it. What makes the income tax burden particularly harmful to the economy is that at the margin, in other words when thinking about the incentives that most strongly influence work and investment, Canadian tax rates are very high even for low-income households, and are especially high in comparison to the United States.
Issues around the reform of corporate income tax rates will be discussed in a separate volume in this series on productivity and issues regarding child care-related deductions and income-splitting will be discussed in the volume on fertility.
University of Calgary economist Trevor Tombe (2024) has calculated the marginal effective personal income tax rates (or METR)[1] by income level that confront workers in Ontario, using the Statistics Canada SPSD/M system. The first figure shows the marginal effective personal income tax rates for an individual in Ontario and the second shows the same for an Ontario family with two children.
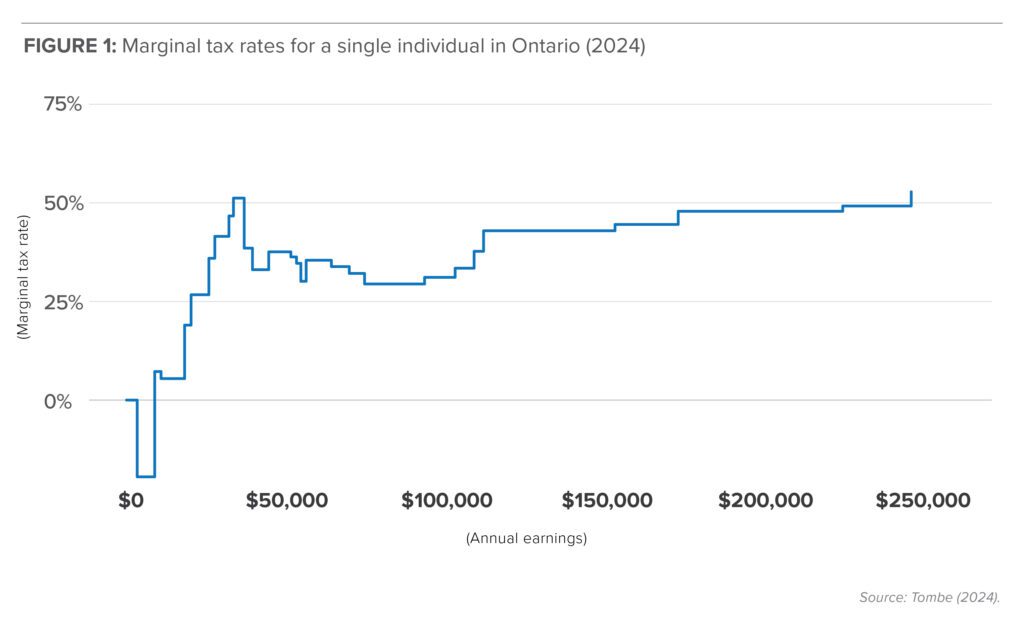
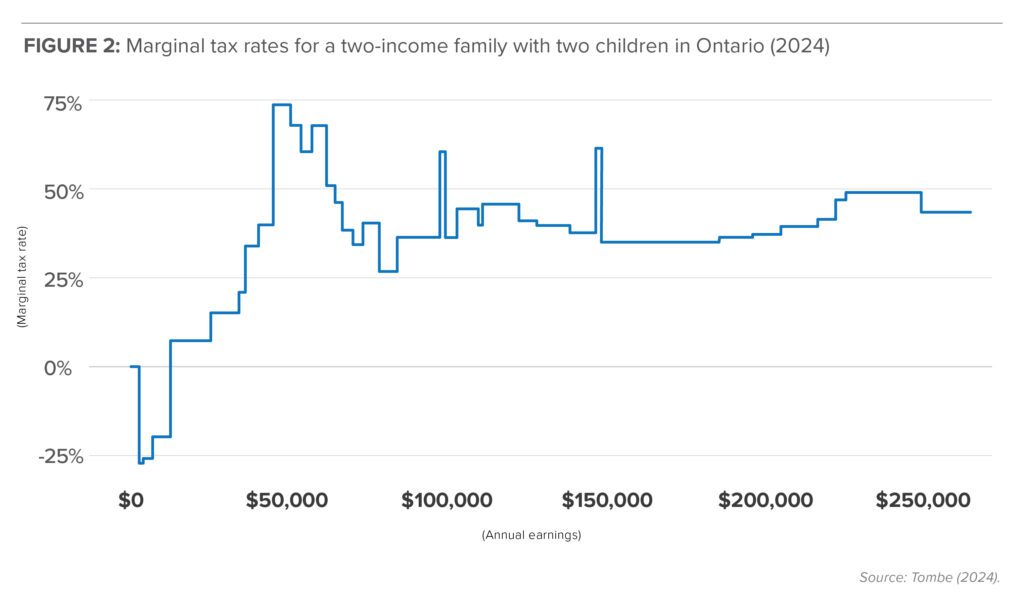
It is self-evident that Ontarians (and Canadians in all provinces) face significant marginal income tax rates. The marginal effective rate rises rapidly to 50 per cent by $50,000 income for an individual and 75 per cent (!) for a couple with children at that income level. It drops briefly to about 30 per cent then returns to the 40 to 50 per cent range thereafter.
There is a clear middle-class family penalty, a “punish effort” effect for incomes between $25,000 and $50,000, and more generally a “success penalty” by which people earning over $200,000 lose close to half of their marginal income to the government.
Furthermore, in most provinces Canadians pay at least 12 per cent sales tax on everything they buy with the money they get to keep. They also pay property taxes, fuel excise taxes, and miscellaneous other fees to government. Therefore, as a rough approximation, on any given day most working Canadians can expect to give over half of the next dollar of income they earn to the government.
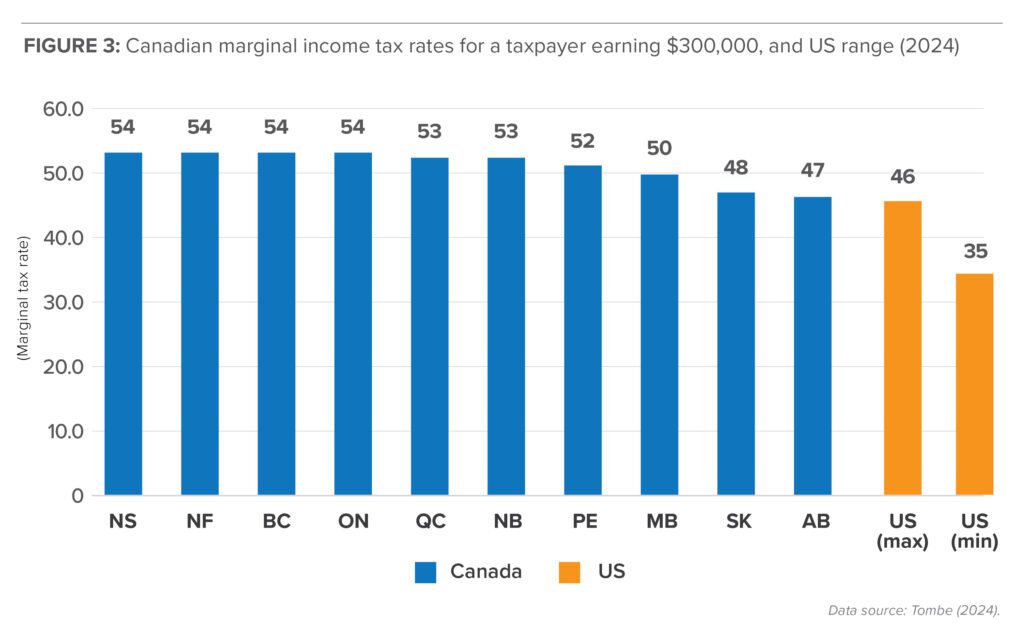
Tombe (2024) also presents striking data comparing marginal personal income tax rates for an individual earning $300,000 in North America. Figure 3 summarizes the information, showing the marginal tax rates for each Canadian province compared to the applicable range for the United States. Canadian data combine federal and provincial rates while US data combine federal and state rates. Canadian provinces have the highest marginal tax rates, going from a minimum of 47 per cent in Alberta to a high of 54 per cent in Nova Scotia. The rate in the highest tax jurisdiction in the US, California (46 per cent), is below that of the lowest tax jurisdiction in Canada, and the remaining states all charge lower rates than that. Eleven states are tied for lowest income tax rate at 35 per cent. Additionally, many states, like Florida, allow spousal income splitting so the effective tax rate is even lower (Keats 2019). Anyone with talent for business or other demanding professions who anticipates reaching the $300,000 income level and who has the option to go to the US pays a significant penalty to stay in Canada.
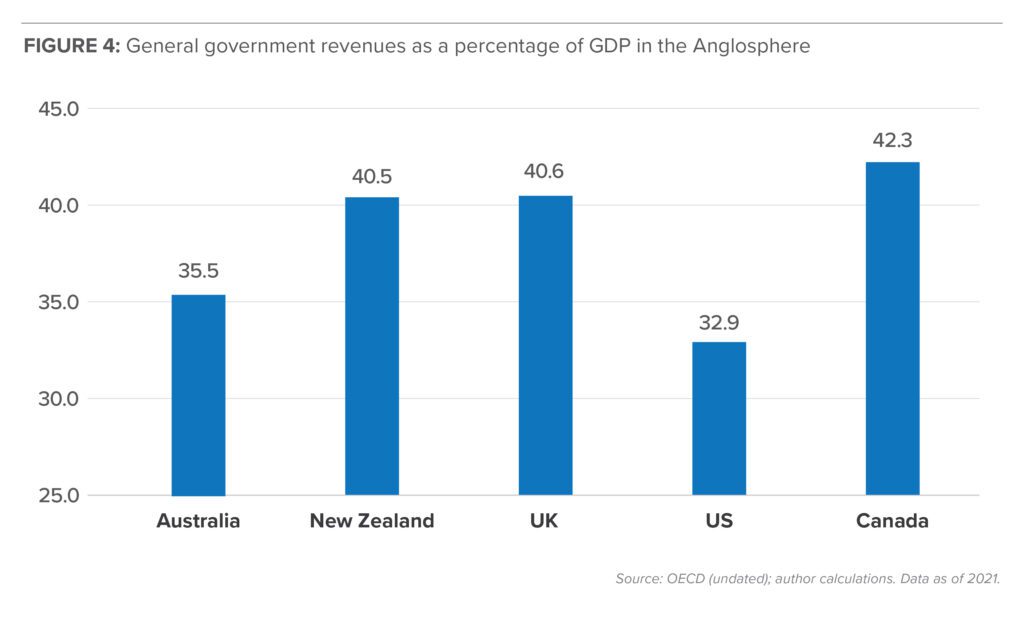
As Figure 4 shows, according to data from the Organization for Economic Cooperation and Development (OECD), Canada’s government now taxes and spends a larger fraction of domestic GDP (42.3 per cent) than do the governments in all other Anglosphere countries (the US, the UK, Australia, and New Zealand).
While Canada compares unfavourably to the US for higher income earners, our tax system has similar progressivity as other countries such as Australia and the UK. Figure 5 shows the ratio of net income to gross income, which represents the fraction of income the recipient gets to keep, from low to high income groups, for a married person with two children.
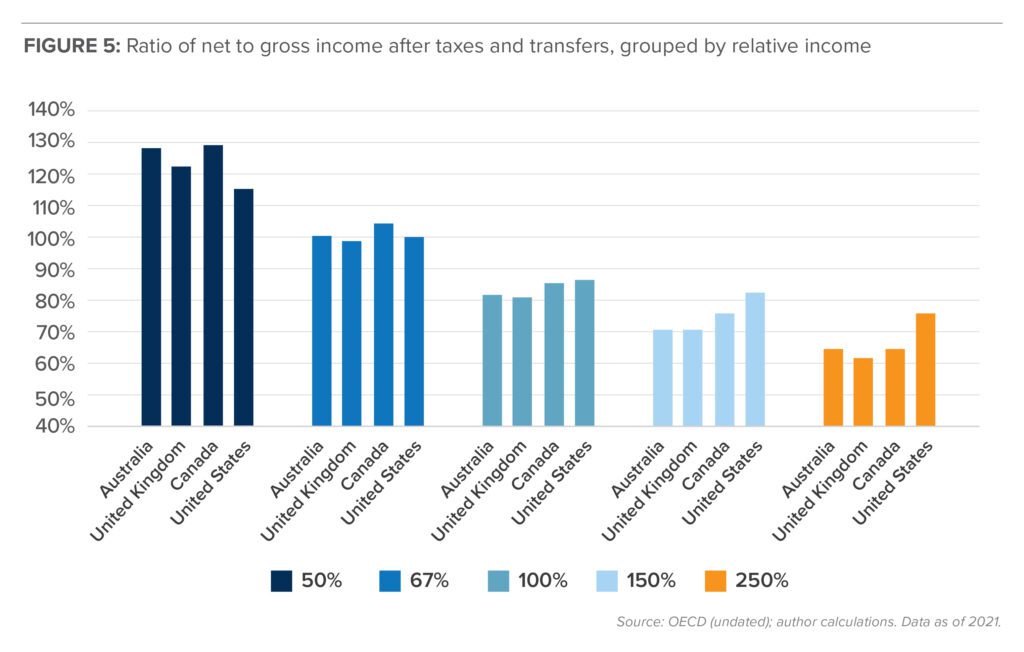
Income in Figure 5 is defined as per cent of average income in that country. So, in the low income group (light blue), defined as persons earning 50 per cent of the average domestic income, in Australia, the UK, and Canada a married taxpayer with two children has a net income equal to between 122 and 129 per cent of gross income, while the US taxpayer takes home 115 per cent of gross income. In other words, for people in this income range, transfers exceed the tax payable.
For taxpayers earning 67 per cent of average income (orange), transfers just cancel income taxes so net income is about equal to gross income (105 per cent in Canada). Once the taxpayer is earning 100 per cent of the average income (gray), net income is now less than 90 per cent of gross earnings, with the portion retained by the taxpayer highest in the US and Canada (87 and 86 per cent respectively) and lower in Australia and the UK. The pattern of US taxpayers retaining more of their gross income than others continues into the higher earning groups. For those earning 250 per cent of the average, the US taxpayer retains 76 per cent of his or her gross earnings, whereas the others retain only 62 to 65 per cent.
Persistent federal deficits
What do we have to show for our relatively large tax grab? One might suppose that with so much money being collected the federal government would have balanced its budget. But instead, the federal debt load has grown continuously.
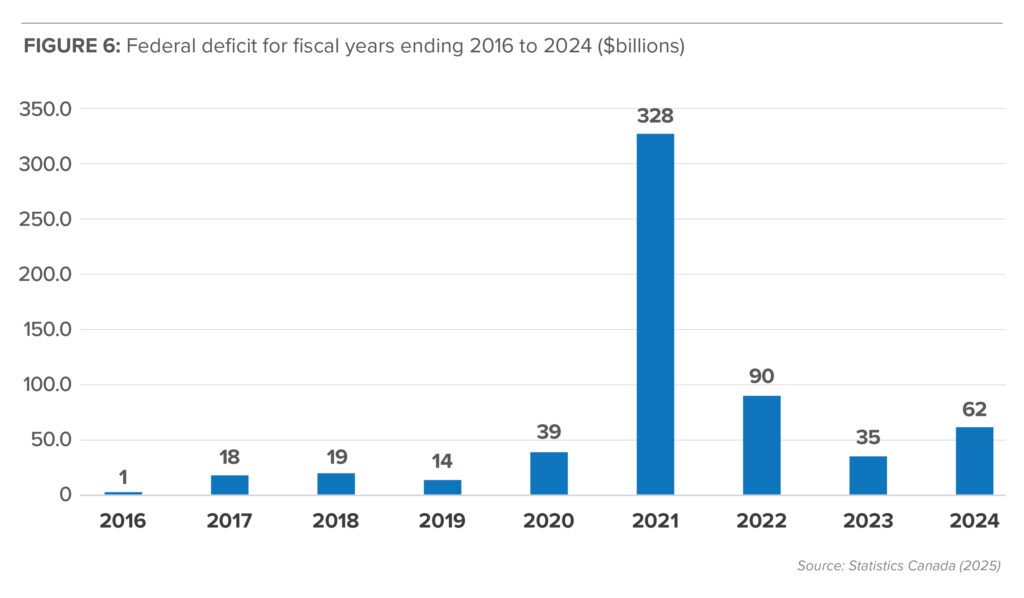
Just before the onset of the COVID-19 pandemic (2019–2020) the federal deficit was 1.7 per cent of GDP. It then soared to 14.1 per cent of GDP in 2020–2021. It fell to 1.3 per cent of GDP by 2022–2023, but in its 2024 Fall Economic Statement (Canada 2024) the federal government admitted that the deficit has grown to $62 billion, which is 2.1 per cent of GDP.
To summarize:
- Canadians pay the highest personal income taxes in North America.
- Combined income and sales taxes mean Canadians effectively give about half their income to the government.
- The Canadian government taxes and spends a relatively large fraction of GDP compared to the rest of the Anglosphere.
- Someone who anticipates medium to high lifetime earnings and who has the option of moving to the United States would face a substantially lower tax burden in any state he or she selects.
- Despite collecting so much in taxes the federal government continues to run large deficits.
An additional problem is that in return for such a large tax burden Canadians do not get good public services. Instead we get mediocre education outcomes, lengthening medical waiting lists, physician shortages, overcrowded hospitals, rising crime, a depleted military, and countless other indicators of inefficiency and ineffectiveness of public management.
A solution strategy
First, cut spending
The federal government’s debt problem results from overspending, not a lack of revenue. Federal program spending has gone up faster than Gross Domestic Product (GDP) since 2015. It rose from 13.6 per cent of GDP in 2015–2016 to 15.9 per cent in 2023–2024, while revenues net of debt charges rose from 13.6 per cent to 14.1 per cent over the same period (Canada, various years).
If government program spending as a fraction of GDP were simply returned to its 2015–2016 level, this would translate into a 14.7 per cent cut in nominal federal spending. In other words, if the government had practiced enough fiscal discipline over the past decade to grow only as fast as the rest of the economy, spending would be about 15 per cent lower. Our discussion of tax reform therefore assumes that a large cut in spending, on the order of 15 per cent, can be implemented.
Second, chisel down the fiscal cliffs
An important problem to address in Canada’s tax system is the series of fiscal “cliffs” (illustrated in Figures 1 and 2) in the $0 – $50,000 earning range that punish effort and discourage work. The federal government needs to work with the provinces to identify and remove these wherever possible. They typically arise whenever a benefit or tax break is introduced with a discrete claw-back point, such as the 2024 HST rebate, which was proposed for people with earnings up to $150,000. By creating a discrete cut-off someone earning $149,995 gets the full amount and someone earning $150,005 gets nothing. It takes relatively little effort to smooth those thresholds out so that the tax burden ramp does not have harsh jumps like the ones currently in place.
For instance, suppose a tax rebate of $300 is proposed for people earning less than $100,000. The formula could be changed to $300 minus $2 for every thousand dollars earned over $100,000 (to a minimum of zero). Below $100,000 the full rebate would be payable. At an income of $150,000 the net rebate would be $300 – (2 x $50) = $200. At $200,000 of income the net rebate would be $100 and at $250,000 or more the net rebate would be zero. The fiscal cliff would thus be a smooth ramp.
Third, cut tax rates
Next, the solution to the problem of high taxes is to enact deep tax cuts, including at the high end. Table 1 outlines the Personal Income Tax (PIT) reform plan developed by Fuss and Munro (2024) of the Fraser Institute, who called for eliminating 149 federal PIT expenditures (boutique tax credits) and replacing the current 5 income tax thresholds with only 2.
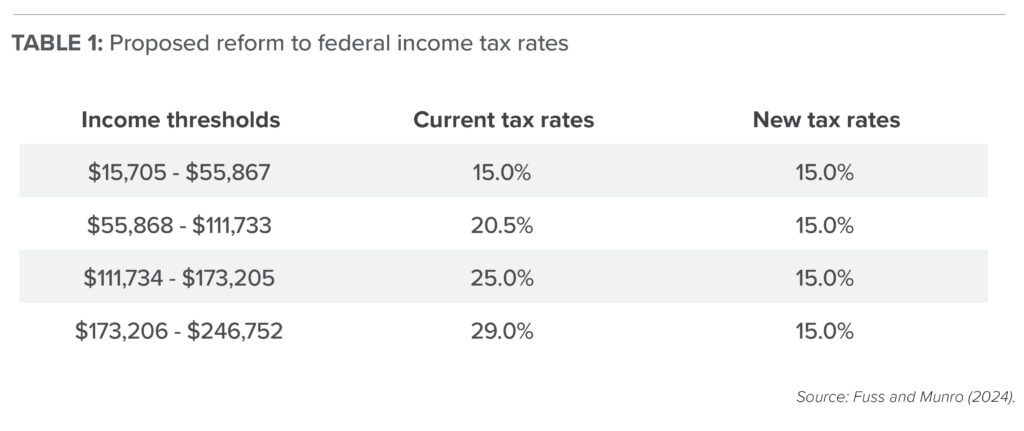
The authors estimate that with a nominal program spending reduction of only 2.3 per cent their plan would result in a balanced budget. Since we are here proposing a 15 per cent spending reduction there remains room to finance a more ambitious tax cut package.
In addition to cutting marginal rates, attention should be paid to the thresholds at which tax rates go up. Canada has very high top marginal income tax rates and they kick in at relatively low thresholds. The threshold for our top marginal rate (about CA$247,000) is less than the starting salary at major US law firms.[1] In light of Canada-US comparisons, the top tax threshold should be raised from $247,000 to at least $500,000 to come closer to matching US rates.
Why tax cuts partly pay for themselves
The Fuss and Munro estimate was calculated with a model that did not fully credit the expansionary effect on the economy of lower marginal tax rates. In general we expect that increases in a tax rate will cause people to take steps to shield their money and the tax base will contract somewhat as a result.[2] The contraction of the tax base in response to a tax determines what economists call the deadweight loss of a tax, namely the loss of economic activity over and above the revenue generated for the government. Different taxes have different proportional deadweight losses. In general, governments should aim to create a tax system that funds the government while causing the smallest possible deadweight losses. Canadian data show that the marginal deadweight losses on income taxes in some provinces exceed the revenue generated (Dahlby and Ferede 2012) indicating that reductions in income taxes have the potential to generate relatively large offsetting increases in the tax base which then reduce the net cost of the tax cut to the government.
Analysts have completed various studies on the responsiveness of the Canadian tax base to tax rate changes. The Parliamentary Budget Office (2019) has estimated that the middle-class tax cut of 2016 resulted in an expansion of the income tax base by 0.47 per cent for every 1.0 per cent reduction in the income tax rate. This is referred to as the tax base elasticity. Dahlby and Ferede (2012) note that the elasticity is larger in the long run than in the short run because some adjustments take time to implement. They estimated that a 1.0 per cent reduction in Canadian personal income tax rates yields a long-run increase in the national income tax base of 3.6 per cent. It is possible to use these elasticities to estimate the per cent change in total tax revenue associated with a one per centage point change in the income tax rate.
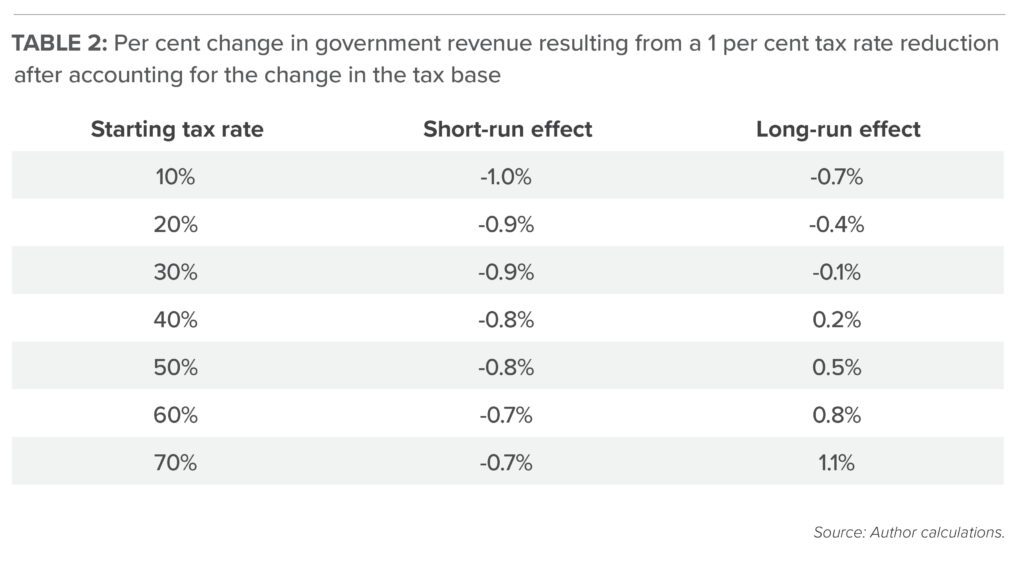
Table 2 summarizes the results. The first column reports the starting tax rate. The experiment considered in each row is a 1 per cent reduction in the tax rate (for instance, from 20 per cent to 19 per cent, from 30 per cent to 29 per cent, etc.). The second column reports the net effect on government tax revenues after taking the short-run tax base response into account (assumed elasticity e = 0.5). If the initial marginal income tax rate is only 10 per cent, a 1 per cent drop (to nine per cent) results in a 1 per cent drop in total tax revenue. But as the initial tax rate rises the change in total taxes also rises, in other words becomes less negative. A drop in the marginal tax rate from 50 per cent to 49 per cent reduces income tax revenues by only 0.8 per cent.
The third column shows the long-run response as the income tax base fully adjusts. When marginal income tax rates are above 35 per cent the increase in the labour supply after a tax cut fully compensates for the drop in the marginal revenue and tax revenues remain constant. For instance, at a starting marginal tax rate of 50 per cent, a cut to 49 per cent results in a long-run increase in total tax revenues of 0.5 per cent.
Taking the likely net effect to be somewhere in the range of short-run to long-run, we can say that, given our high marginal rates, income tax cuts in Canada will at least partially, and perhaps fully, pay for themselves over the long run due to the increase in the income tax base resulting from the lower marginal rates.
Maintaining progressivity
Policies to increase the size of the economic pie have a high propensity to appear to increase inequality, especially in the early phase of implementation, before the benefits have dispersed through the economy. The reason is that when productivity is unleashed, the most productive individuals benefit first, and they tend to be the highest earners.
At the same time, they are also the ones who pay the most taxes. In Canada, the top 20 per cent of earners (households with combined earnings above $240,000) receive 46 per cent of total income but pay nearly 63 per cent of all income taxes. The top 40 per cent (households with combined earnings above $158,000) earn 70 per cent of the income but pay 83 per cent of all income taxes. This means the bottom 60 per cent of income earners (well over half the country) only pay 17 per cent of all income taxes (Fuss and Li 2024).
Hence, if taxes are cut across the board, the largest portion of the cuts will go to the wealthiest individuals because they are the ones paying the most taxes. This is an unavoidable implication of mathematics. It results from the fact that the tax system is progressive: if the tax burden is reduced then those who pay most will experience the largest reduction.
However, with a small modification to the Fuss and Munro plan, the accusation that the biggest tax cuts will go to the rich can be eliminated. Figure 7 compares the taxes owing under the current federal income tax brackets to what would be owing under the proposed tax brackets (15 per cent up to $253,414 and 29 per cent above that).
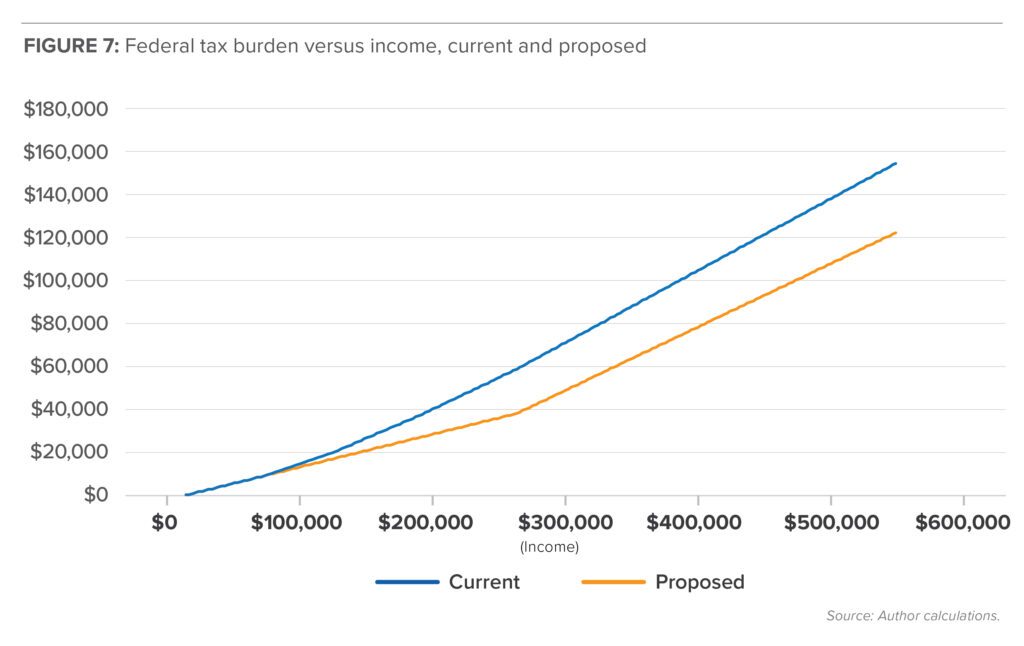
Figure 8 shows that the value of the tax cut expressed as a percentage of income is smallest for earners below $100,000, is effectively zero for earners below $55,000 income, and reaches a maximum for earners at about $250,000 income.
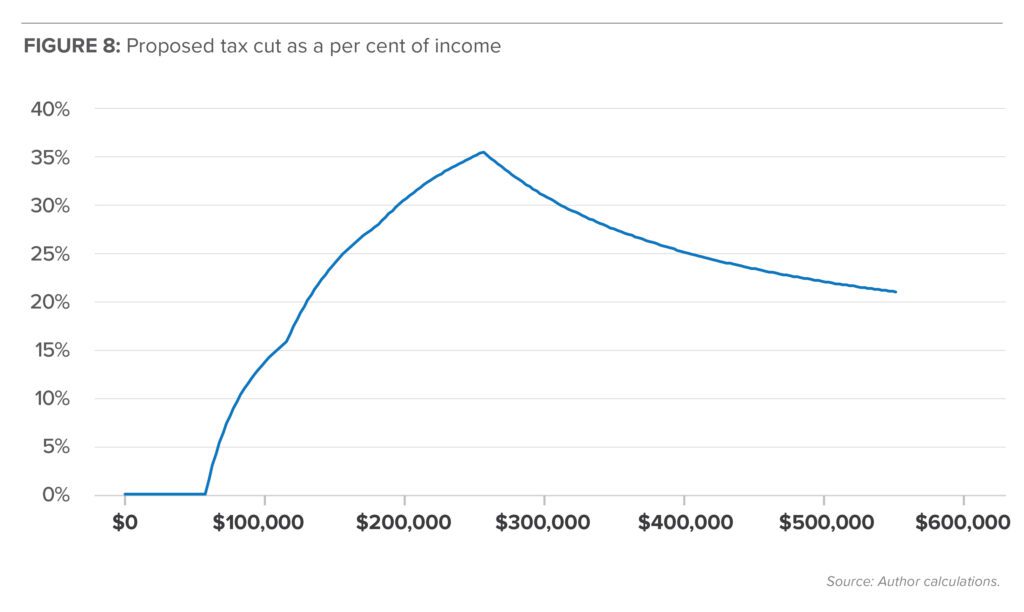
This would seem to support the case that the proposed tax cut is regressive. That argument could be partially blunted, however, simply by doubling the personal deduction from $4,999 to $9,999, which would result in the tax cut as a per cent of income changing to that shown in Figure 9.
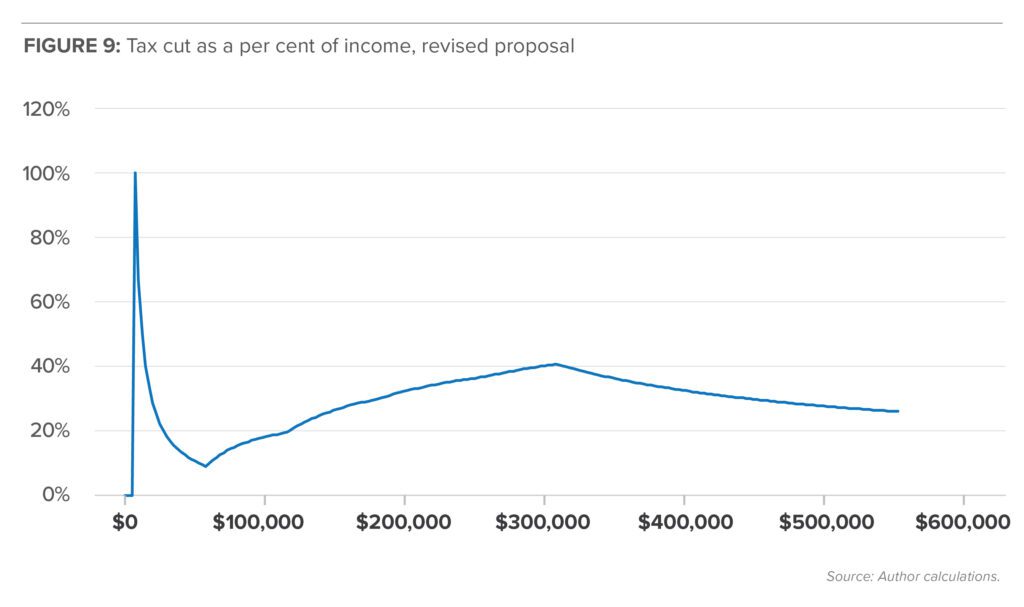
Now the maximum gains accrue to the lowest income earners (above the zero-owing threshold). While people earning $250,000 would get a 40 per cent tax reduction, so would people earning less than $17,500. Moreover, once we account for dependents, the picture changes even further. The tax cut profile for a family with a single income earner and two dependents would now look like that shown in Figure 10.
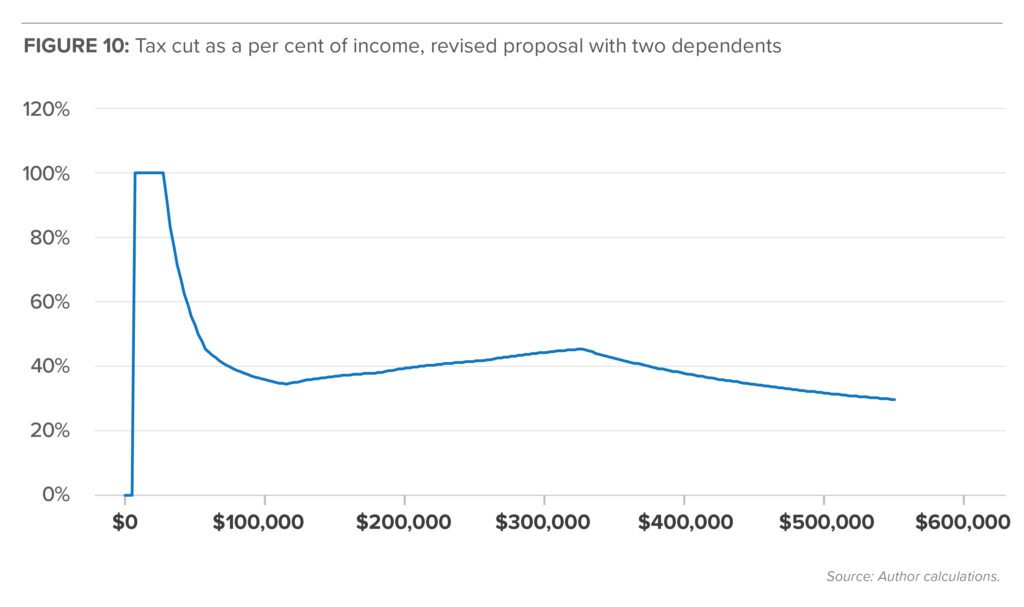
Thus, for a family with dependents, the tax cut is strongly progressive, having a maximum value for people whose income is below $30,000 and declining almost monotonically above that.
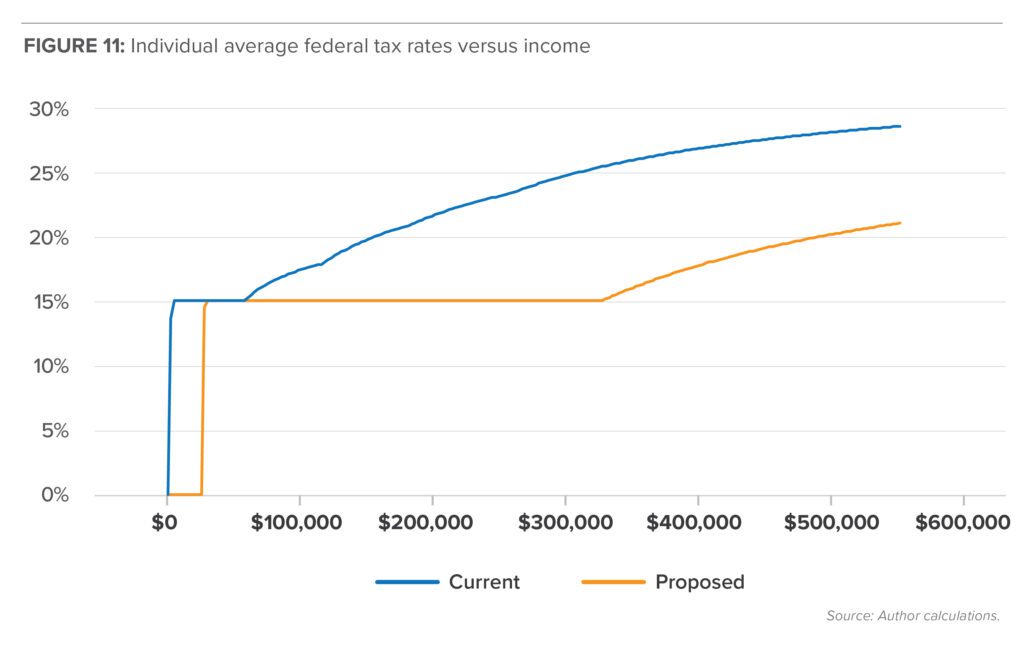
Another aspect worth considering is the threshold for the top tax bracket. This is important as a signal for high-skilled individuals to plan a career in Canada. Currently the top tax bracket kicks in at $253,414. This could be raised to $300,000, and if so, the profile of average tax rates for an individual, assuming the basic personal deduction is raised to $9,999, would be as shown in Figure 11.
Government spending and the GDP figure
As we noted above, it is appropriate to pay for income tax cuts with spending reductions. The government should not worry that this will generate fears of a recession because any recession will be temporary. As Statistics Canada calculates it, GDP is defined as C+I+G+X-M, where C is private consumption, I is investment, G is government spending, X is exports, and M is imports. Cutting a dollar from government spending cuts a dollar from topline nominal GDP. Governments might fear that, say, a $30 billion spending cut will show up in the national accounts as a 1 per cent reduction in GDP, i.e., a recession. But that is mere accounting. The second-order economic effects will be a reduction in borrowing costs, downward pressure on interest rates, increased consumption and investment (C+I), an expanded trade surplus (X-M) and, as tax cuts boost C+I, more rapid GDP growth in the years ahead. Spending cuts need to happen early in a government’s mandate to allow time for the rebound economic effects to take place.
Conclusion
Canadian income tax rates are too high, both in absolute terms and compared to our closest competitor, the United States. We need changes that reduce rates and simplify the tax code. In particular, we need to bring down high marginal effective tax rates on low- and middle-income Canadians and more generally aim for tax rates in line with those of the US. We cannot rely on the argument that Canadians ought to accept higher taxes because we get better public services, since our high-visibility public services like health care and education are mediocre at best, even with our heavy tax burden. Nor can we justify high taxes by saying they are necessary to maintain a favourable debt trajectory since the debt-to-GDP ratio has been rising.
The government must undertake a comprehensive program to reduce expenditures to create fiscal room for substantial tax cuts, although we should note that some of the cost of a tax cut will be paid for by the resulting economic expansion. Reforms should include reducing the rates and the numbers of tax brackets. While the macroeconomic effects of those changes will depend on the details of the tax reform package, shrinking the cost of funding government will generate benefits for all Canadians by allowing household incomes to grow and the private sector to thrive.
About the author
Ross McKitrick holds a PhD in economics from the University of British Columbia (1996) and is a professor of economics at the University of Guelph in Guelph, Ontario. He is the author of Economic Analysis of Environmental Policy (University of Toronto Press 2010). He has been actively studying climate change, climate policy, and environmental economics since the mid-1990s. He built and published one of the first national-scale Computable General Equilibrium models for analyzing the effect of carbon taxes on the Canadian economy in the 1990s. His academic publications have appeared in many top journals. He has also written policy analyses for the Fraser Institute (where he is a senior fellow), the CD Howe Institute, the University of Calgary School of Public Policy, and other Canadian and international think-tanks. In addition to his economics research his background in applied statistics has led him to collaborative work across a wide range of topics in the physical sciences including paleoclimate reconstruction, malaria transmission, surface temperature measurement, and climate model evaluation.
References
Canada. 2024. “Fiscal Outlook.” Economic and Fiscal Overview. Government of Canada, Department of Finance. Available at https://budget.canada.ca/update-miseajour/2024/report-rapport/overview-apercu-en.html#3-fiscal-outlook.
Canada. Various years. “Public Accounts of Canada.” Government of Canada. Available at https://www.canada.ca/en/public-services-procurement/services/payments-accounting/public-accounts.html.
Dahbly, Bev, and Ergete Ferede. 2012. “The Effects of Tax Rate Changes on Tax Bases and the Marginal Cost of Public Funds for Canadian Provincial Governments.” International Tax and Public Finance 19 (January 20): 844–883. Available at https://link.springer.com/article/10.1007/s10797-012-9210-7 [paywall].
Fuss, Jake, and Grady Munro. 2024. A New Federal Fiscal Framework for Canada. Fraser Institute. Available at https://www.fraserinstitute.org/sites/default/files/new-federal-fiscal-framework-for-canada.pdf.
Fuss, Jake, and Nathaniel Li. 2024. Measuring Progressivity in Canada’s Tax System, 2024. Fraser Institute. Available at https://www.fraserinstitute.org/sites/default/files/measuring-progressivity-in-canadas-tax-system-2024.pdf.
Keats, Robert. 2019. The Border Guide: The Ultimate Guide to Living, Working and Investing Across the Border, 12th edition. Self-Counsel Press.
Munro, Grady, and Jake Fuss. 2024. “June 23 is Balanced Budget Tax Freedom Day in Canada.” Commentary. Fraser Institute. Available at https://www.fraserinstitute.org/commentary/june-23-balanced-budget-tax-freedom-day-canada.
Organisation for Economic Cooperation and Development [OECD]. Undated. OECD Data Explorer. OECD. Available at https://data-explorer.oecd.org/.
Parliamentary Budget Officer. 2019. Revisiting the Middle-Class Tax Cut. Office of the Parliamentary Budget Officer. Available at https://distribution-a617274656661637473.pbo-dpb.ca/8646eb63400a4965f5a6a1827fe69b1317347ffb18aaef186e6188c24a3f2758.
Quinn Emanuel. 2025. “U.S. Compensation and Benefits.” Quinn Emanuel. Available at https://www.quinnemanuel.com/careers/us-compensation-and-benefits/.
Statistics Canada. 2025. “Table 10-10-0015-01: Statement of Government Operations and Balance Sheet, Government Finance Statistics (x 1,000,000).” Statistics Canada. Available at https://www150.statcan.gc.ca/t1/tbl1/en/tv.action?pid=1010001501.
Tombe, Trevor. 2024. “What a Pro-Growth Tax Reform Might Look Like.” Deep Dive. The Hub, June 24, 2024. Available at https://thehub.ca/2024/06/24/deepdive-what-a-pro-growth-tax-reform-might-look-like/.
[1] METR refers to combined income taxes and social benefit clawbacks associated with each additional dollar earned.
[2] See, for example, Quinn Emanuel (2025), which quotes a starting salary of US$225,000.
[3] Activity to shield income from taxes includes moving out of the country altogether. For Canadians with US family connections or some other US connection the option of seeking US residency for tax purposes is relatively straightforward (Keats 2019)..