

By Dave Snow
August 6, 2026
In late July 2026, Statistics Canada delivered something Canadians have not heard often in recent years: good news about crime. Although Canada’s violent crime rate was essentially unchanged from 2024, Statistics Canada reported declines across several other metrics in 2025: the overall crime rate (down 2 per cent), overall crime severity (down 5 per cent), violent crime severity (down 4 per cent), and rates of child sexual abuse and exploitation material offences (down 21 per cent), motor vehicle theft (down 16 per cent), and breaking and entering (down 11 per cent).
One particularly good piece of news was the homicide rate, which fell by 16 per cent, the largest annual decline since 1986 (Statistics Canada 2026a). After years in which worsening crime statistics had become a recurring feature of Canada’s political debate, these numbers represent real and welcome progress.
However, as is so often the case with crime statistics, the devil is in the details. And those details show that it is too early to declare victory.
First and foremost, the improvements need to be understood in the context of trends over the last decade. In particular, both the violent crime rate and violent crime severity remain close to their highest levels this century, with the violent crime severity index still higher than it was for every year between 2008 and 2021. Likewise, the police-reported hate crime rate declined by 4 per cent in 2025, but it is still nearly triple what it was as recently as 2016 (Statistics Canada 2026b). In addition, the national trends mask important regional variations, especially given that much of the decline in violent crime severity occurred in Ontario. Violent crime severity actually worsened in three provinces and two territories, including a growth of 8 per cent in Nunavut and 9 per cent in New Brunswick (Statistics Canada 2026a; Statistics Canada 2026c).
To understand the extent and significance of Canada’s latest crime statistics, this commentary examines the longer-term trends, the differences among provinces and urban areas, and the areas of crime that demand policymakers’ attention. It shows that although the 2025 declines are welcome, reversing the past decade’s rise in violent crime will require much more than one encouraging year.
What Changed in 2025
Police services record criminal incidents and submit standardized data to Statistics Canada, which compiles and publishes national crime statistics each summer. Within this data, Statistics Canada distinguishes between crime rates and crime severity. The crime rate measures the number of criminal incidents reported to police per 100,000 people. An incident may involve more than one offence, but it is generally classified according to its most serious violation. For example, a minor assault and a homicide are each counted as one “incident” per 100,000 in the violent crime rate.
By contrast, Statistics Canada’s crime severity index (CSI), created in the late 2000s, does not treat each criminal “incident” as having equal weight. Instead, the CSI assigns each offence a weight based primarily on how frequently it results in imprisonment and the typical length of the sentence. Serious offences are weighted more heavily in the CSI. Statistics Canada publishes separate violent and non-violent severity indexes, allowing analysts to distinguish changes in offences against persons from changes in property crime, drug crime, and other offences (Statistics Canada 2009; Statistics Canada 2026c). Police-reported data have important limitations: they exclude offences that victims do not report and can be affected by differences in local policing and recording practices (see Anglin 2025, Snow 2026a). Nevertheless, they remain the most widely used source for tracking police-reported crime trends over time.
Even within police-reported data, there are many ways in which to measure the amount, type, and severity of crime. Accordingly, the analysis below separates the overall crime rate from the violent crime rate, and violent crime severity from non-violent crime severity. While my previous work for the Macdonald-Laurier Institute has used three-year rolling averages to reduce the effect of annual fluctuations (Snow and Audas 2025), the data I present below uses annual (non-rolling) data to emphasize the 2025 data in their own right.
Figure 1: Overall and Violent Crime Rates in Canada, 1998–2025
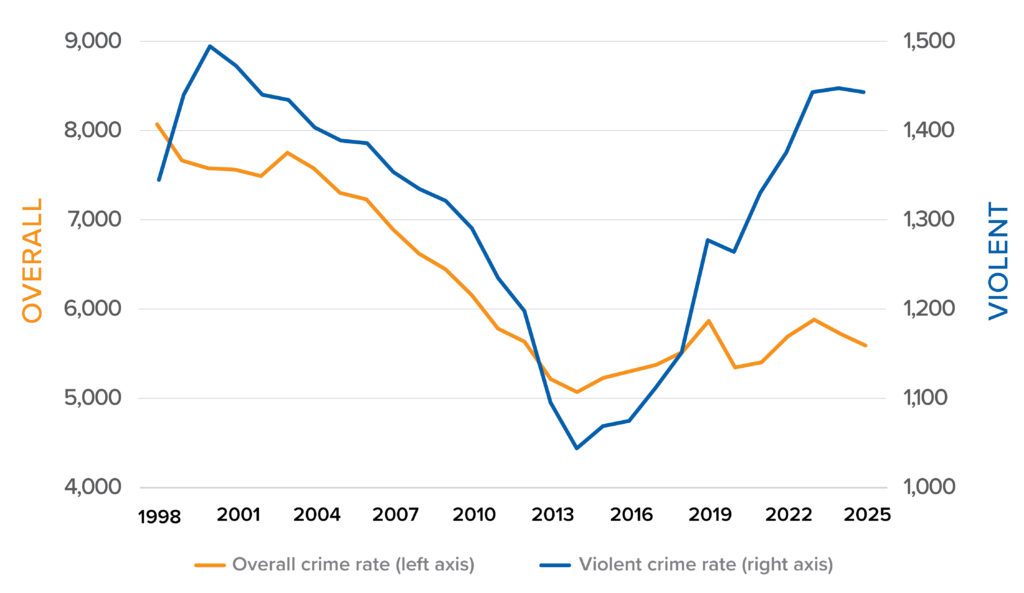
Figure 1 shows that the 2025 improvement in the overall crime rate was concentrated outside of violent crime. The overall crime rate fell by 2.4 per cent – its second consecutive annual decline – to 5,585 incidents per 100,000 people. By contrast, the violent crime rate barely moved, declining by just 0.3 per cent to 1,443 incidents per 100,000 people (Statistics Canada 2026e). That difference is even more striking in historical context. Both measures reached their recent lows in 2014, but the violent crime rate subsequently climbed much more sharply and in 2025 remained 35 per cent above its 2015 level.
Figure 2: Violent and Non-Violent Crime Severity Indexes for Canada, 1998–2025
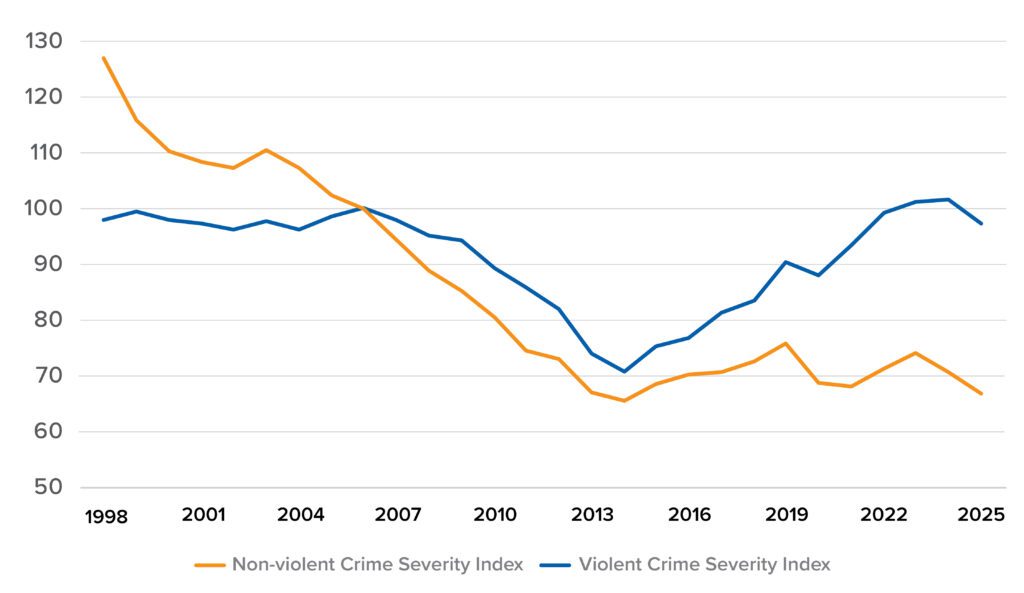
The severity indexes reveal that violent and non-violent crime share a similar pattern. As Figure 2 shows, both the violent and non-violent crime severity indexes fell in 2025. Yet the two measures remain in very different positions relative to previous years. Across the entire CSI series (which extends back to 1998), the non-violent crime severity index is at its lowest level since 2014, having remained relatively flat (between 67 and 76) over the last decade. By contrast, violent crime severity is below its 2024 peak, but it is still higher than in any year between 2008 and 2021; it remains almost 30 per cent above where it stood in 2015 (Statistics Canada 2026c).
The apparent improvement in 2025 also comes with an important statistical wrinkle. When Statistics Canada first published its 2024 figures in July 2025, it placed the violent crime severity index at 99.9; as part of its regular revision process, the agency has since revised that figure upward to 101.4—the highest value in the series dating back to 1998 (Statistics Canada 2025; Statistics Canada 2026c). The 2025 decline is therefore measured from a worse starting point than previously understood: Canada improved last year, but only after violent crime severity reached a newly recognized record high. Put more simply, violent crime severity fell by 4 per cent in 2025, but it fell from the highest level recorded in the data series, which dates back to 1998.
Table 1: Percentage Change in Selected Canadian Crime Indicators, 2024–2025 and 2015–2025
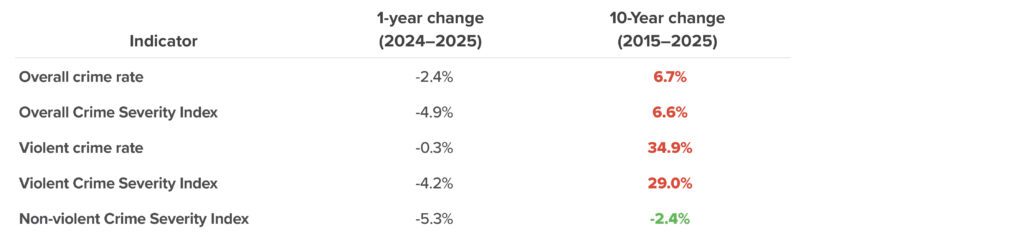
Table 1 makes the long- and short-term contrast clear. It looks at changes in violent, non-violent, and overall crime rates and severity over the last decade. (Statistics Canada does not publish a separate “non-violent crime rate.”) All five indicators declined in Canada in 2025, although the violent crime rate’s 0.3 per cent decrease amounted to virtually no change. However, the decade-long comparison puts this decline in context, as the overall crime rate and overall crime severity index were each nearly 7 per cent higher than in 2015. Only the non-violent CSI is lower today than it was ten years ago (Statistics Canada 2026c; Statistics Canada 2026e).
The main contrast occurs with respect to violent crime. Between 2015 and 2025, the violent crime rate increased by 35 per cent and the violent crime severity index by 29 per cent. This shows that while non-violent crime has improved over the last decade, violent crime is still much more frequent and severe in 2025 than it has been for most of this century, despite the slight dip in 2025. It will take a far larger decrease in violent crime to make up for the increases of the previous decade.
Collectively, these figures provide important context about crime in Canada in 2025. However, national totals also tell us little about where these improvements occurred or how widely they were shared; for that, we must turn to data from individual provinces and territories.
Regional gaps in violent crime remain stark
The slight improvement in Canada’s national crime indicators was broadly reflected across the provinces and territories, but it was not universal. As Table 2 shows, the numbers for overall crime were welcome: crime severity declined in 11 of 13 provinces and territories between 2024 and 2025. The only exceptions were New Brunswick (up 6 per cent) and Nunavut (up 10 per cent). The overall crime rate also fell in most jurisdictions, with Nunavut the only jurisdiction that saw a substantial rise (Statistics Canada 2026c; Statistics Canada 2026e).
Table 2: Percentage Change in Selected Crime Indicators by Province and Territory, 2024–2025
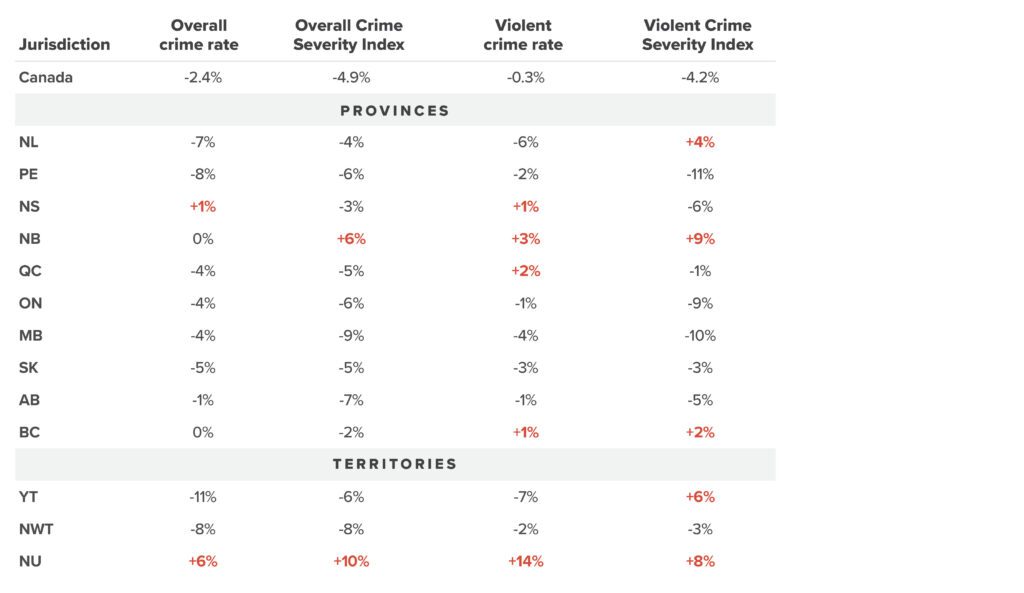
However, violent crime was subject to more jurisdictional variation. The violent crime severity index increased in five jurisdictions, with the largest increases occurring in New Brunswick (up 9 per cent) and Nunavut (up 8 per cent). The violent crime rate also rose in five jurisdictions, although the increase was relatively minor outside of Nunavut (up 14 per cent). In only three jurisdictions did both the violent crime rate and the violent CSI increase: New Brunswick, British Columbia, and Nunavut. By contrast, both measures decreased in six jurisdictions, notably in Manitoba (down 4 per cent and 10 per cent) and Saskatchewan (both down 3 per cent). In two jurisdictions (Newfoundland & Labrador and Yukon), the violent crime rate fell even as violent crime severity increased. Homicide is likely part of the explanation: Newfoundland & Labrador recorded 12 homicides in 2025, up from four in 2024, while Yukon went from no homicides in 2024 to three in 2025.
These jurisdictional comparisons lead to three conclusions. First, the 2025 improvements in overall crime rates did not eliminate Canada’s longstanding concentration of violent crime in the Prairie provinces and territories. In 2025, Manitoba and Saskatchewan recorded violent CSIs of 195 and 194, respectively – double the national figure of 97. Their violent crime rates were also roughly 60 per cent and 80 per cent higher, respectively, than the national rate. Second, the moderate improvement in 2025 did not erase the deterioration of the previous decade. Both the violent crime rate and violent CSI remained higher in every province and territory in 2025 than in 2015. Indeed, in 11 of 13 jurisdictions, the violent crime rate was at least 25 per cent higher and the violent CSI at least 20 per cent higher than a decade earlier. Third, the territories remain in a category of their own. The violent CSI reached 236 in Yukon, 556 in the Northwest Territories, and 719 in Nunavut (compared with 97 for the country as a whole). Put differently: even after improving in 2025, the Northwest Territories’ violent CSI remained nearly six times the national level, while Nunavut’s was more than seven times as high.
Mixed results across major urban areas
The provincial variation is reflected in Canada’s largest urban areas. Figure 3 shows the annual violent crime severity index for the same 20 census metropolitan areas examined in the Macdonald-Laurier Institute’s 2025 Urban Violent Crime Report—the 18 largest for which data are available, plus Moncton and St. John’s (Snow and Audas 2025).
Figure 3: Violent Crime Severity Index in Major Canadian Urban Areas, 2015–2025
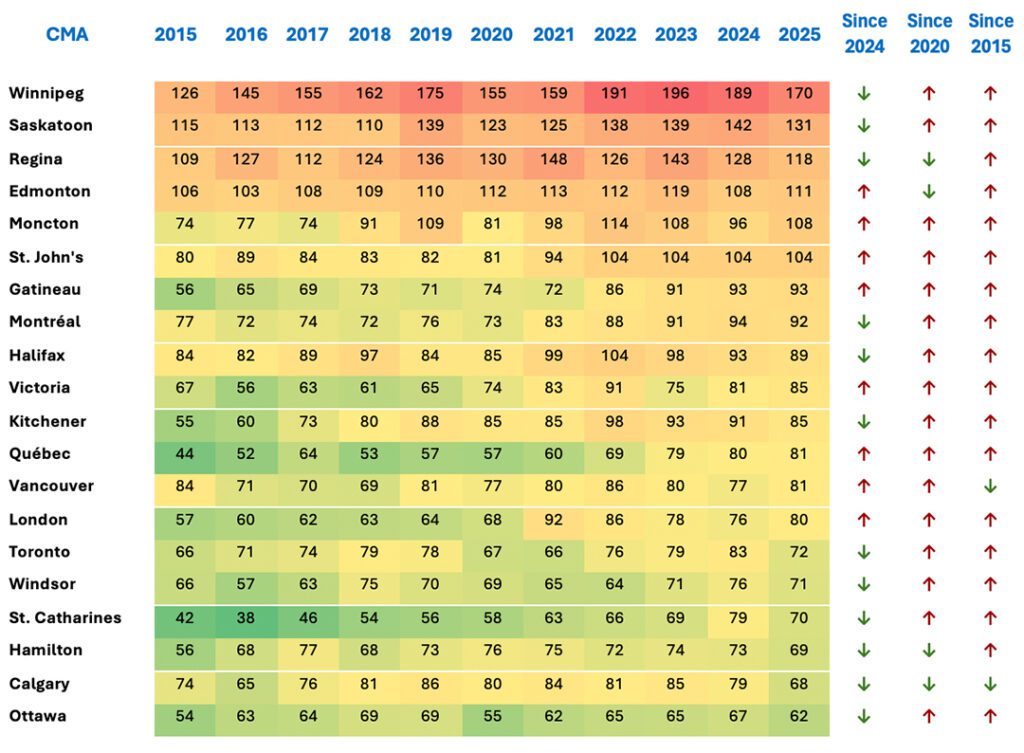
On the one hand, like the provincial numbers, 2025 contained short-term good news in some areas. Violent crime severity declined in 12 of the 20 CMAs in 2025, including several of Canada’s largest urban areas. Toronto recorded the largest reduction (down 14 per cent), with Calgary, St. Catharines-Niagara, and Winnipeg also experiencing declines of 10 per cent or more. Even Winnipeg, whose violent CSI remained by far the highest among the selected CMAs, saw a substantial decline, from 189 in 2024 to 170 in 2025. By contrast, Moncton experienced a 12 per cent year-over-year increase in its violent CSI, while Victoria and Vancouver (5 per cent) and London (4 per cent) also saw large increases.
On the other hand, these overall short-term declines have not come close to reversing the previous decade’s growth in crime severity in most major urban areas. Although violent crime severity declined in most of the selected urban areas in 2025, the longer comparison is less reassuring: 16 of the 20 CMAs still had a higher violent CSI than in 2020, and 18 had a higher violent CSI than in 2015. The five- and ten-year increases were substantial in many urban areas. Five CMAs had violent CSIs that were at least 25 per cent higher than in 2020, most notably Quebec City at 43 per cent and Moncton at 32 per cent. Since 2015, the picture looks even worse, particularly in some medium-sized CMAs: Quebec City’s violent CSI increased by 83 per cent, while Gatineau’s rose by 67 per cent and St. Catharines-Niagara by 66 per cent. Only Calgary and Vancouver have a lower violent CSI than a decade ago. Overall, despite the welcome improvement in 2025, the vast majority of major urban areas still have considerably higher violent crime severity than they did five or ten years ago.
Homicide fell for a third consecutive year
The best news concerns homicide. Police reported 672 homicides in 2025, a rate of 1.61 per 100,000 people. This was the third consecutive year in which Canada’s homicide rate fell and represented a 16 per cent decline from 2024 – and was the largest annual decrease since 1986 (Statistics Canada 2026a). Although homicide rates can fluctuate sharply from year to year in smaller jurisdictions, the national improvement is clear.
Figure 4: Police-Reported Homicide Rate in Canada, 1998–2025
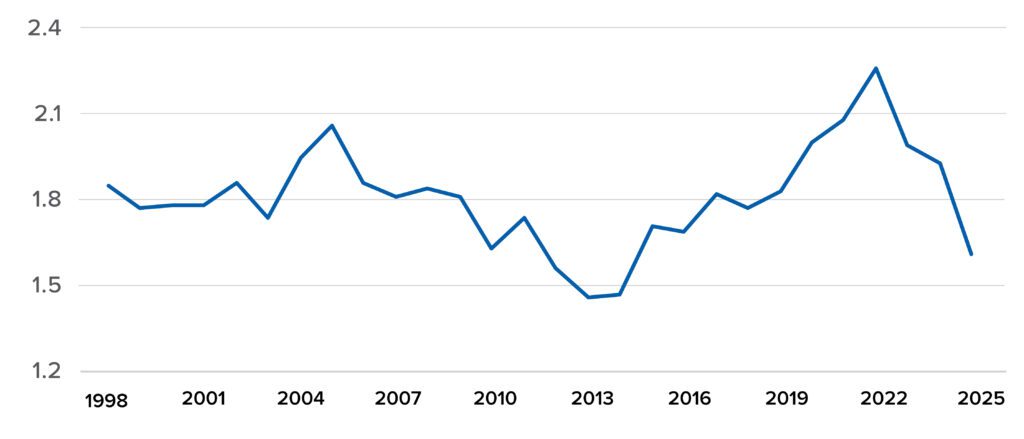
As Figure 4 shows, unlike violent crime rates and crime severity more broadly, homicide has returned to approximately the level it was in the middle of the previous decade. While Canada’s homicide rate in 2022 was the highest since the early 1990s, it has since fallen by 29 per cent and is now closer to historic levels. The improvement was also reasonably widespread across the country. Homicide rates declined in seven of the 10 provinces in 2025, with increases limited to Newfoundland & Labrador, Prince Edward Island, and British Columbia. Some provinces saw significant decreases, with a 43 per cent drop in Manitoba (from 6.37 to 3.64 per 100,000), 28 per cent in Ontario, and 25 per cent in Nova Scotia. Nevertheless, important regional differences remain. With Manitoba’s significant drop, Saskatchewan now has the dubious distinction of having the highest provincial homicide rate, at 5.21 per 100,000, more than three times the national rate. And as with other violent crime metrics, the territories remain in a category of their own, with homicide rates nearly four times the national rate in Yukon, nearly seven times higher in the Northwest Territories, and more than ten times higher in Nunavut (Statistics Canada 2026e).
Hate crime declined but remained historically high
Police-reported hate crime also declined in 2025, although the improvement was considerably more modest than for homicide. Police reported 4,708 hate crimes, while the population-adjusted rate fell by 4 per cent, from 11.8 to 11.4 incidents per 100,000 people. However, as Figure 5 shows, the rate remains historically high and is still nearly three times its 2016 level (Statistics Canada 2026b).
Figure 5: Police-Reported Hate Crime Rate in Canada, 2014–2025
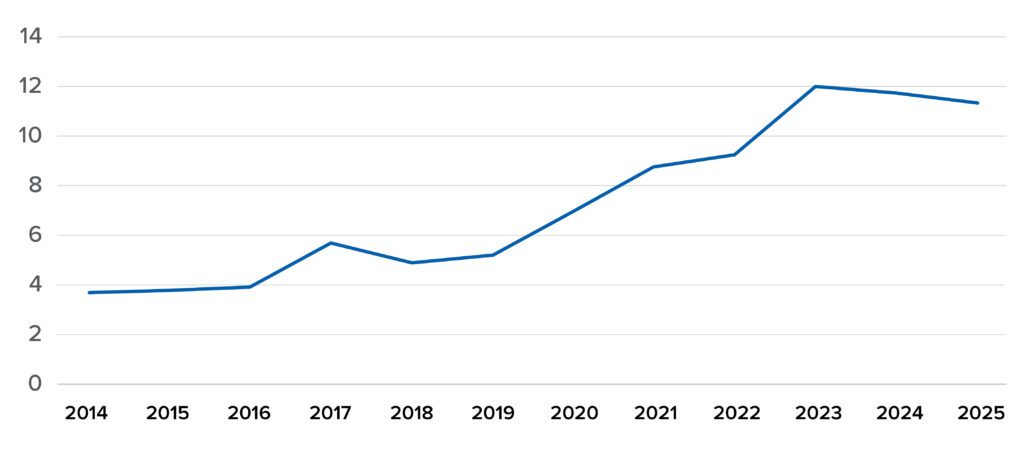
The national decline also concealed substantial differences across cities and communities. Hate-crime rates in Peterborough, Victoria, and Kitchener–Cambridge–Waterloo – perhaps not the cities many Canadians would expect to find at the top of the list – were each more than twice the national average. Differences among targeted communities were starker still. Statistics Canada reported 788 hate crimes targeting Jewish people in 2025, which was 16 per cent fewer than in 2024, but still 60 per cent higher than in 2021. Although Jewish Canadians constitute approximately 1 per cent of Canada’s population, they were targeted in 71 per cent of religion-motivated hate crimes. By way of comparison, Muslims constitute approximately 5 per cent of Canada’s population and were targeted in 18 per cent of religion-motivated hate crimes, while Catholics constitute approximately 30 per cent of the population and were targeted in 3 per cent of religion-motivated hate crimes (Statistics Canada 2023; Statistics Canada 2026d).
These figures put hard numbers behind what recent incidents have already made clear: antisemitism has reached shameful levels in Canadian society. In recent weeks, gunfire targeted two Jewish-owned Toronto bakeries, Hasidic men were attacked in Montreal, a Montreal kosher restaurant was the target of suspected arson, and a visibly Jewish man allegedly had a brick thrown at him by an attacker who shouted that Jews were “baby killers committing genocide” (Gordon 2026; Lewis 2026; Lowman 2026). The data confirm that these were not isolated aberrations, but manifestations of a broader pattern that has become unacceptably commonplace.
Clearance rates barely improved
The final measure considered here is the clearance rate, which captures the extent to which police-reported crimes are solved or otherwise cleared by police. An incident is considered cleared when police lay or recommend a charge, or resolve it in another way recognized by Statistics Canada. Like the Crime Severity Index, the principal clearance rate measure is weighted according to the seriousness of the offence. My previous research showed that violent and non-violent crime weighted clearance rates both deteriorated substantially between 2015 and 2024 in every province and territory (Snow 2026b).
Figure 6: Violent Crime Weighted Clearance Rate in Canada, 1998–2025
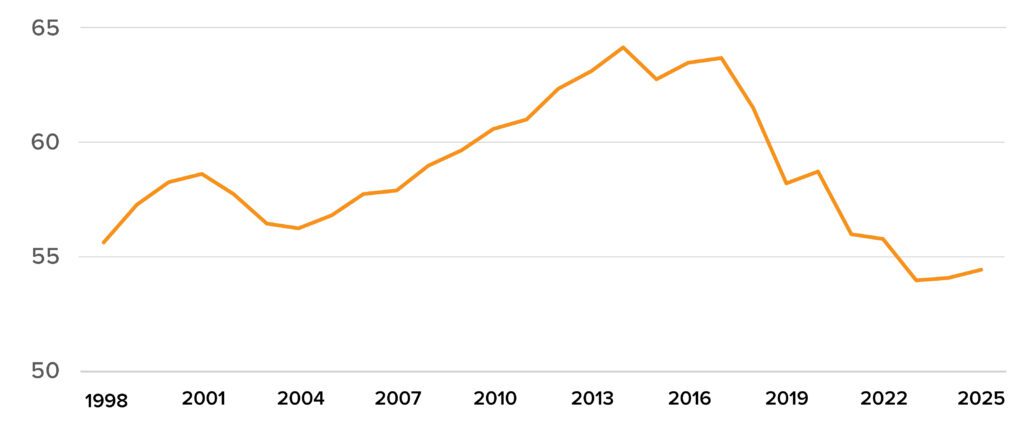
Unfortunately, there is little evidence that this has been reversed in any meaningful way. As Figure 6 shows, Canada’s violent crime weighted clearance rate did tick up slightly in 2025, but it rose by less than half a percentage point to 54 per cent (the non-violent crime clearance rate moved up by one percentage point, from 25 to 26). More importantly, Canada’s violent crime weighted clearance rate remains eight percentage points below its 2015 level. Indeed, violent crime clearance rates actually decreased in five provinces and two territories in 2025. British Columbia’s rate fell to 35 per cent, the lowest in the country, while Prince Edward Island and New Brunswick also experienced substantial declines (PEI dropped from 49 to 42 per cent). The only provinces whose clearance rates rose by more than one percentage point in 2025 were Quebec and Newfoundland & Labrador (both 3 per cent) (Statistics Canada 2026c).
The conclusion from Figure 6 is unmistakable: despite its slight improvement, the 2025 violent crime clearance rate was still the third-lowest recorded since comparable data became available in 1998, exceeding only the rates in 2023 and 2024. Even as violent crime went down, police were solving violent crimes at a lower rate than at almost any point in the last generation.
Conclusion
Canada’s 2025 crime statistics show some good news, but they are not grounds for a victory lap. The overall crime severity index declined, homicide fell sharply for a third consecutive year, and several provinces and major urban areas experienced meaningful improvements in both the rate and severity of violent crime. However, a single year of improvement has not reversed the troubling trends of the previous decade. Violent crime severity is nearly 30 per cent higher than it was in 2015, hate crime remains historically high, and the violent crime clearance rate was still the third-lowest recorded since 1998. Canada’s criminal justice system still faces substantial challenges.
The improvement should nevertheless be taken seriously. Part of the decline may reflect the fading effects of pandemic-era disruptions to all facets of the criminal justice system. Meanwhile, heightened public attention and policy action at both the federal and provincial levels may have begun to bear fruit. It is too early to know whether 2025 marks the beginning of a sustained trend, but policymakers should aim to build on this progress. Genuine recovery will require sustained and widespread declines in violent crime and a reversal of the longstanding drop in police clearance rates, not to mention improvements in the timeliness of criminal trials (see Clarke 2026; Snow 2026c). One encouraging year is a start; reversing a decade of deterioration must be the goal.
About the author
Dave Snow is an associate professor in the Department of Political Science and the graduate coordinator of the Criminal Justice and Public Policy program at the University of Guelph. He is the author of Assisted Reproduction Policy in Canada: Framing, Federalism, and Failure, and the co-editor (with F.L. Morton) of Law, Politics, and the Judicial Process in Canada, 5th Edition.
References
Anglin, Howard. 2025. “Lies, Damned Lies, and Crime Statistics.” The Hub, September 9. Available at https://thehub.ca/2025/09/09/howard-anglin-lies-damned-lies-and-crime-statistics/.
Clarke, Dylan R. 2026. “Timing Justice: Trial Delays, Court Congestion, and the Limits of R. v. Jordan.” Macdonald-Laurier Institute, February 11. Available at https://macdonaldlaurier.ca/timing-justice-trial-delays-court-congestion-and-the-limits-of-r-v-jordan-dylan-r-clarke/.
Gordon, Dave. 2026. “Toronto lawyer says he was attacked in the street for being Jewish.” National Post, July 2. Available at https://nationalpost.com/news/canada/toronto-lawyer-says-he-was-attacked-in-the-street-for-being-jewish.
Lewis, Stewart. 2026. “Popular kosher restaurant in Montreal destroyed in apparent arson attack.” National Post, August 1. Available at https://nationalpost.com/news/canada/popular-kosher-restaurant-in-montreal-destroyed-in-arson-attack.
Lowman, Harrison. 2026. “Jews Being Attacked Is Canada’s New Normal.” The Hub, July 28. Available at https://thehub.ca/2026/07/28/jews-being-attacked-is-canadas-new-normal/.
Snow, Dave, and Richard Audas. 2025. Urban Violent Crime Report, Volume 2: Comparing Crime Across Canadian Cities. Macdonald-Laurier Institute. https://macdonaldlaurier.ca/wp-content/uploads/2025/11/Urban-Violent-Crime-Report_Final.pdf.
Snow, Dave. 2026a. “Why Violent Crime Is Surging in Canada: DeepDive.” The Hub, February 23. Available at https://thehub.ca/2026/02/23/violent-crime-is-surging-in-canada-deepdive/.
Snow, Dave. 2026b. “Nearly 50% of All Violent Offences Go Unpunished in Canada—Why Police Are Solving Fewer Crimes.” The Hub, April 7. Available at https://thehub.ca/2026/04/07/why-police-are-solving-fewer-crimes-in-canada-as-nearly-50-of-all-violent-offences-go-unpunished-deepdive/.
Snow, Dave. 2026c. “Justice Delayed: Nearly 60% of Violent Crime Cases Are Stayed or Withdrawn in Canada.” The Hub, June 30. Available at https://thehub.ca/2026/06/30/justice-delayed-nearly-60-of-violent-crime-cases-are-stayed-or-withdrawn-in-canada/.
Statistics Canada. 2009. Measuring Crime in Canada: Introducing the Crime Severity Index and Improvements to the Uniform Crime Reporting Survey. Catalogue no. 85-004-X. Statistics Canada. Available at https://www150.statcan.gc.ca/n1/pub/85-004-x/85-004-x2009001-eng.pdf.
Statistics Canada. 2023. “Census Profile, 2021 Census of Population: Canada.” Catalogue no. 98-316-X2021001. Statistics Canada. Available at https://www12.statcan.gc.ca/census-recensement/2021/dp-pd/prof/details/page.cfm?DGUIDlist=2021A000011124&GENDERlist=1&HEADERlist=32&LANG=E&STATISTIClist=1&SearchText=Canada.
Statistics Canada. 2025. “Police-Reported Crime Statistics in Canada, 2024.” The Daily, July 22. Statistics Canada. Available at https://www150.statcan.gc.ca/n1/daily-quotidien/250722/dq250722a-eng.htm.
Statistics Canada. 2026a. “Police-Reported Crime Statistics in Canada, 2025.” The Daily, July 22. Statistics Canada. Available at https://www150.statcan.gc.ca/n1/daily-quotidien/260722/dq260722a-eng.htm.
Statistics Canada. 2026b. “Table 35-10-0191-01: Police-Reported Hate Crime, Number of Incidents and Rate Per 100,000 Population, Provinces, Territories, Census Metropolitan Areas and Canadian Forces Military Police.” Statistics Canada. Available at https://www150.statcan.gc.ca/t1/tbl1/en/tv.action?pid=3510019101.
Statistics Canada. 2026c. Statistics Canada. Available at https://www150.statcan.gc.ca/t1/tbl1/en/tv.action?pid=3510002601.
Statistics Canada. 2026d. “Table 6: Police-reported hate crimes, by detailed motivation, Canada, 2021 to 2025.” In “Police-Reported Crime Statistics in Canada, 2025.” The Daily, July 22. Statistics Canada. Available at https://www150.statcan.gc.ca/n1/daily-quotidien/260722/t006a-eng.htm.
Statistics Canada. 2026e. “Table 35-10-0177-01: Incident-Based Crime Statistics, by Detailed Violations, Canada, Provinces, Territories, Census Metropolitan Areas and Canadian Forces Military Police.” Statistics Canada. Available at https://www150.statcan.gc.ca/t1/tbl1/en/tv.action?pid=3510017701.