
This article originally appeared in The Hub.
By Dave Snow, April 7, 2026
Recent months have seen a wave of extortion attempts targeting business owners in British Columbia and Ontario, with some involving arson and even shootings. As a response, police task forces and the Canada Border Services Agency have stepped up efforts to crack down on organized crime, amid concerns that many extortion incidents are going unreported. These developments come as Canada faces rising violent crime and a growing public debate about safety. They raise a pressing question: how many crimes are actually being solved?
This DeepDive answers that question by examining “clearance rates,” the share of crimes solved by police. The trends are alarming. Clearance rates have steadily fallen over the last decade for both violent and non-violent crime, and the decline is widespread across every province and territory. Unsurprisingly, this drop has occurred alongside rising violent crime severity and a decline in police per capita.
This pattern fits a broader trend across the criminal justice system. Alongside increased violence, trial delays, and a strained bail system, police are also solving fewer crimes—yet another sign of a system stretched beyond its capacity.
What clearance rates measure
A clearance rate measures the proportion of reported criminal incidents solved by police in a given year. According to Statistics Canada’s Uniform Crime Reporting (UCR) classification system, police begin by classifying reported criminal incidents as “founded” or “unfounded.” An incident is considered founded if it occurred or cannot be ruled out, and unfounded if it did not occur. Unfounded incidents are excluded from clearance rates.
Founded incidents fall into three categories: cleared by charge (or recommended), cleared otherwise, or not cleared.
Incidents are cleared “by charge or charges recommended” when a suspect has been identified and a charge is laid, recommended, or recommended but declined by the Crown.
Incidents can be “cleared otherwise” for a range of reasons, including the death of the suspect or complainant, diversion (particularly under the Youth Criminal Justice Act), departmental discretion, or commitment to a mental health facility.
An incident is not cleared if it remains under investigation, lacks sufficient evidence, or the complainant/victim declines to proceed.
The clearance rate is the share of incidents that are cleared—whether by charge, recommended charge, or otherwise—out of all founded incidents.
Clearance rates vary considerably by crime. Violent offences, particularly those that involve a direct confrontation between offender and victim, are far more likely to be cleared than property crimes such as breaking and entering or motor vehicle theft. Even within the same category of crime, some cases are harder to solve; for example, homicides involving gangs, drugs, and/or firearms have lower clearance rates than other homicides. Not surprisingly, homicide clearance rates have declined from 95 percent in the 1960s to 72 percent in the 2020s.
The main clearance rate reported by Statistics Canada is “weighted” using the same method as the crime severity index (CSI). This weighting reflects both the frequency and severity of crime, with more serious offences carrying greater weight. Weighted clearance rates tend to be slightly lower than unweighted rates because of high-volume, high-severity, low-clearance offences such as robberies and break-ins. Like the CSI, Statistics Canada reports overall, violent, and non-violent weighted clearance rates.
Fewer crimes are being solved across Canada
The charts below track trends in weighted clearance rates across Canada from 1998 (the first year for which weighted data are available) to 2024. All charts use three-year rolling averages to prevent annual fluctuations from skewing the data (the value for “2000” is the average of the values of 1998, 1999, and 2000; the value for “2024” is the average of the values for 2022, 2023, and 2024).
The first chart tracks weighted violent, non-violent, and overall clearance rates, showing a consistent trend: an increase in crimes solved between the mid-2000s and mid-2010s, followed by a decline since 2016. The violent clearance rate, which hovered around 63 percent between 2014 and 2018, dropped to 55 percent by 2024. The non-violent clearance rate has plummeted from a high of 32 percent in 2013 to 25 percent in 2024—the lowest rate since tracking began in 1998.
To measure provincial variation in clearance rates, the “heat map” below displays the violent weighted clearance rate for every province and territory during the same period (the highest rates are dark green, the lowest are dark red).
Two trends emerge. First, over the last decade, violent clearance rates have declined in every province and territory. Second, some regions have experienced more rapid declines than others. The rate fell by between 13 and 32 percentage points in every Atlantic Canadian province and all three territories, while the smallest declines (7 and 5 percentage points) occurred in Quebec and Ontario. British Columbia continues to have the lowest violent crime clearance rate, with its rolling average dropping below 40 percent for the first time in 2024.
There are many reasons for baseline differences between provincial clearance rates, including local crime rates, targeted enforcement strategies, and a jurisdiction’s proportion of “easier to solve crimes.” One oft-cited factor is the use of “pre-charge screening,” a practice whereby police must obtain prosecutorial approval before charges are laid. However, pre-charge screening does not appear to explain regional variation in clearance rates. In 2024, the five provinces with pre-charge screening spanned the full range of violent clearance rates, with Quebec (2nd) and Manitoba (4th) near the top, Alberta (6th) in the middle, and New Brunswick (10th) and British Columbia (13th) near the bottom. Whatever the sources of regional variation, the decade-long decline in clearance rates is national and widespread.
Urban Canada is no exception
What about Canadian cities? The second heat map tracks changes in the violent weighted clearance rates in Canada’s 18 largest census metropolitan areas (CMAs) for which data are available, as well as Moncton, NB, and St. John’s, NL. Again, we see that clearance rates have dropped in nearly every major urban area, with especially high declines in mid-sized areas such as St. Catharines, Kitchener, London, Victoria, and Moncton. Clearance rates are lowest in British Columbia and Atlantic Canadian CMAs, along with Kitchener.
By contrast, violent clearance rates have declined more modestly in Toronto, Hamilton, Quebec City, Regina, Saskatoon, and Calgary. Windsor is the clear outlier, with its violent clearance rates steadily rising by nearly 10 percentage points over the last decade. Interestingly, Windsor’s rolling non-violent rate moved in the opposite direction, decreasing from 30 to 23 percent over this period.
Why clearance rates are falling
While no single factor explains the sustained decline in clearance rates over the last decade, one plausible explanation is that as crime increases, police have less time to solve it. Consistent with earlier evidence showing Canadian clearance rates rose as crime declined, the chart below shows an inverse relationship between violent crime severity and violent clearance rates over the past two decades. When violent crime severity fell between 2005 and 2015, clearance rates rose; when violent crime severity rose between 2015 and 2024, clearance rates fell.
However, this relationship does not hold for non-violent crime severity. The chart below shows that, while the non-violent clearance rate followed the same pattern as the violent clearance rate, the severity of non-violent crimes has increased only slightly over the last decade (from 68 to 71 on the crime severity index).
While somewhat counterintuitive, it is worth remembering that all crimes are investigated within police services constrained by finite resources. As violent crime increases, those resources are inevitably pulled toward the most serious and urgent cases. Major investigations—especially homicides, shootings, and other high-priority violent incidents—can require large teams and stretch over long periods, drawing personnel away from property crime and non-violent incidents. In an era of rising violent crime, non-violent crimes receive less attention and resources, which can ultimately lead to lower clearance rates. Rising violent crime puts pressure on the entire system.
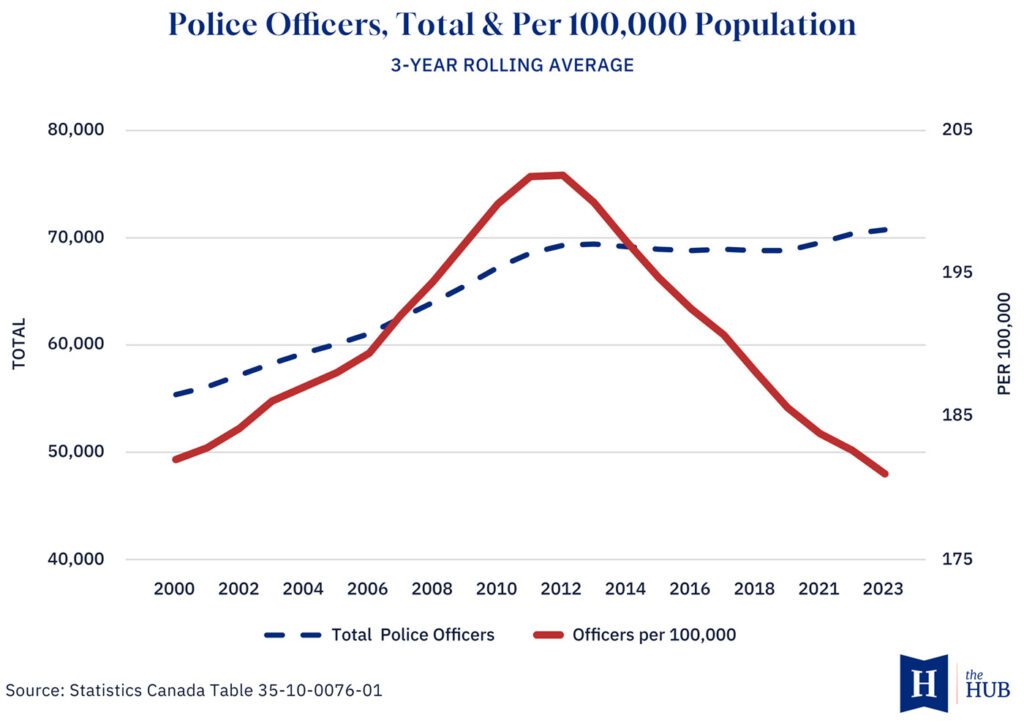
This pressure has been exacerbated by another development: reduced police capacity. The dashed line in the chart below shows that there was a 25 percent growth in the absolute number of police officers between 2000 and 2012, but that number has since plateaued, with only 2 percent growth between 2012 and 2023.
As Canada’s population skyrocketed from 35 million to 40 million people during the same period, this translated into a substantial per capita decline in police: between 2012 and 2023, the number of police officers per 100,000 people fell by roughly 10 percent, from 202 to 181.
More severe violent crime, more people, and fewer officers per capita. Is it any surprise clearance rates are declining?
Do “unfounded” incidents explain the decline?
There is one final factor worth exploring: the rise of criminal incidents deemed “unfounded.” Beginning in 2018, Statistics Canada began working with police services to raise the threshold for an “unfounded” incident. Driven by concerns that police were too readily classifying sexual assaults as unfounded, the new “victim-centred approach” states that “unless there is concrete evidence to prove the crime did not happen, it is to be believed that the crime occurred.”
This new definition has led to a steady decline in the proportion of “unfounded” incidents, with sexual assaults declining from 14 percent to 7 percent unfounded between 2017 and 2022, and violent crimes declining from 12 percent to 7 percent unfounded between 2017 and 2024 (unfounded property crime declined by a smaller amount, from 5.7 percent to 3.7 percent).
This change was expected to reduce clearance rates at the margins, as more difficult-to-solve cases would now be deemed “founded” and included in the clearance rate denominator. To gauge the impact of this change on clearance rates, the charts below recalculate cleared incidents as a proportion of all alleged incidents (founded and unfounded) for 2017 to 2024, the only years for which Statistics Canada’s new “unfounded” data are available (because of three-year rolling averages, the first data point is 2019). These charts compare these recalculated clearance rates to the weighted clearance rate for all crimes and for violent crimes.
Three notes of caution should be taken when analyzing these charts: first, they compare clearance rates for all (founded plus unfounded) incidents to clearance rates for founded incidents. Second, they compare official weighted clearance rates to recalculated unweighted clearance rates. Third, unlike Statistics Canada’s weighted clearance rates, the recalculated rates reflect incidents cleared in a given year, regardless of when the incident occurred. Because the numerator includes some incidents from previous years while the denominator includes only those reported in the current year, the figures may not align perfectly with official clearance rates and should be interpreted with caution (although this is somewhat mitigated by using rolling averages).
Even with these limitations, the comparison is still useful: if the drop in clearance rates were simply the result of fewer incidents being classified as unfounded, these recalculated rates (dashed lines) would stay flat over time.
That is not what we see: even when accounting for Statistics Canada’s more inclusive definition of “founded” incidents, clearance rates have declined substantially since 2017. Crimes cleared as a proportion of all (founded and unfounded) criminal incidents dropped from 40 to 35 percent between 2017 and 2024, and from 59 to 52 percent for violent criminal incidents specifically.
No matter how you measure it, the decline in clearance rates is real.
A system reaching its limits
This DeepDive identifies yet another aspect of Canada’s criminal justice system under strain: police are solving fewer crimes. The decline in clearance rates extends across all Canadian provinces and territories and nearly every major Canadian city. Alongside rising violent crime, lengthy trials, a broken bail system, and an increasing proportion of cases stayed or withdrawn, these declining clearance rates show a criminal justice system in crisis.
The most intuitive explanation for the decline in clearance rates is also the most compelling: police are being asked to do more with less. As violent crime becomes more frequent and severe, it demands greater time, resources, and investigative capacity. At the same time, as Canada’s population has grown, the number of police officers per capita has declined, stretching those resources even further.
The result is predictable: more people, more violence, more demanding cases, and fewer crimes solved.
If anything, the problem may be understated. There is mounting evidence that the Canadian public feels increasingly unsafe due to concerns about crime, that confidence in the system is eroding, and that many crimes are unreported—a pattern police themselves have identified with extortion. If, as Howard Anglin has written in these pages, people have learned not to bother reporting low-level crime to unresponsive police, then official clearance rates may present an overly optimistic picture of system performance. The true gap between crimes committed and solved may be even larger than the data suggest.
The sustained decline in clearance rates points to a deeper problem: in many respects, the trajectory of Canada’s criminal justice system mirrors the health-care system during and after COVID-19. The pandemic initially created a short-term shock to health care, but has since exposed deeper, longer-term capacity constraints.
A similar pattern is now evident in criminal justice: the pandemic initially disrupted courts, policing, and case processing, and in doing so, accelerated an ongoing erosion in system capacity.
In the end, declining clearance rates are yet another sign of a criminal justice system stretched beyond its limits and failing to perform its core functions. Canadians can be forgiven for feeling that justice is increasingly out of reach.
Dave Snow is an Associate professor in political science at the University of Guelph and a senior fellow at the Macdonald-Laurier Institute.